
Adam Alfano leads sales at Salesforce.
On 3 February 2026 his company published the seventh edition of its State of Sales report. It surveyed 4,050 sales professionals in 22 countries in August and September 2025.
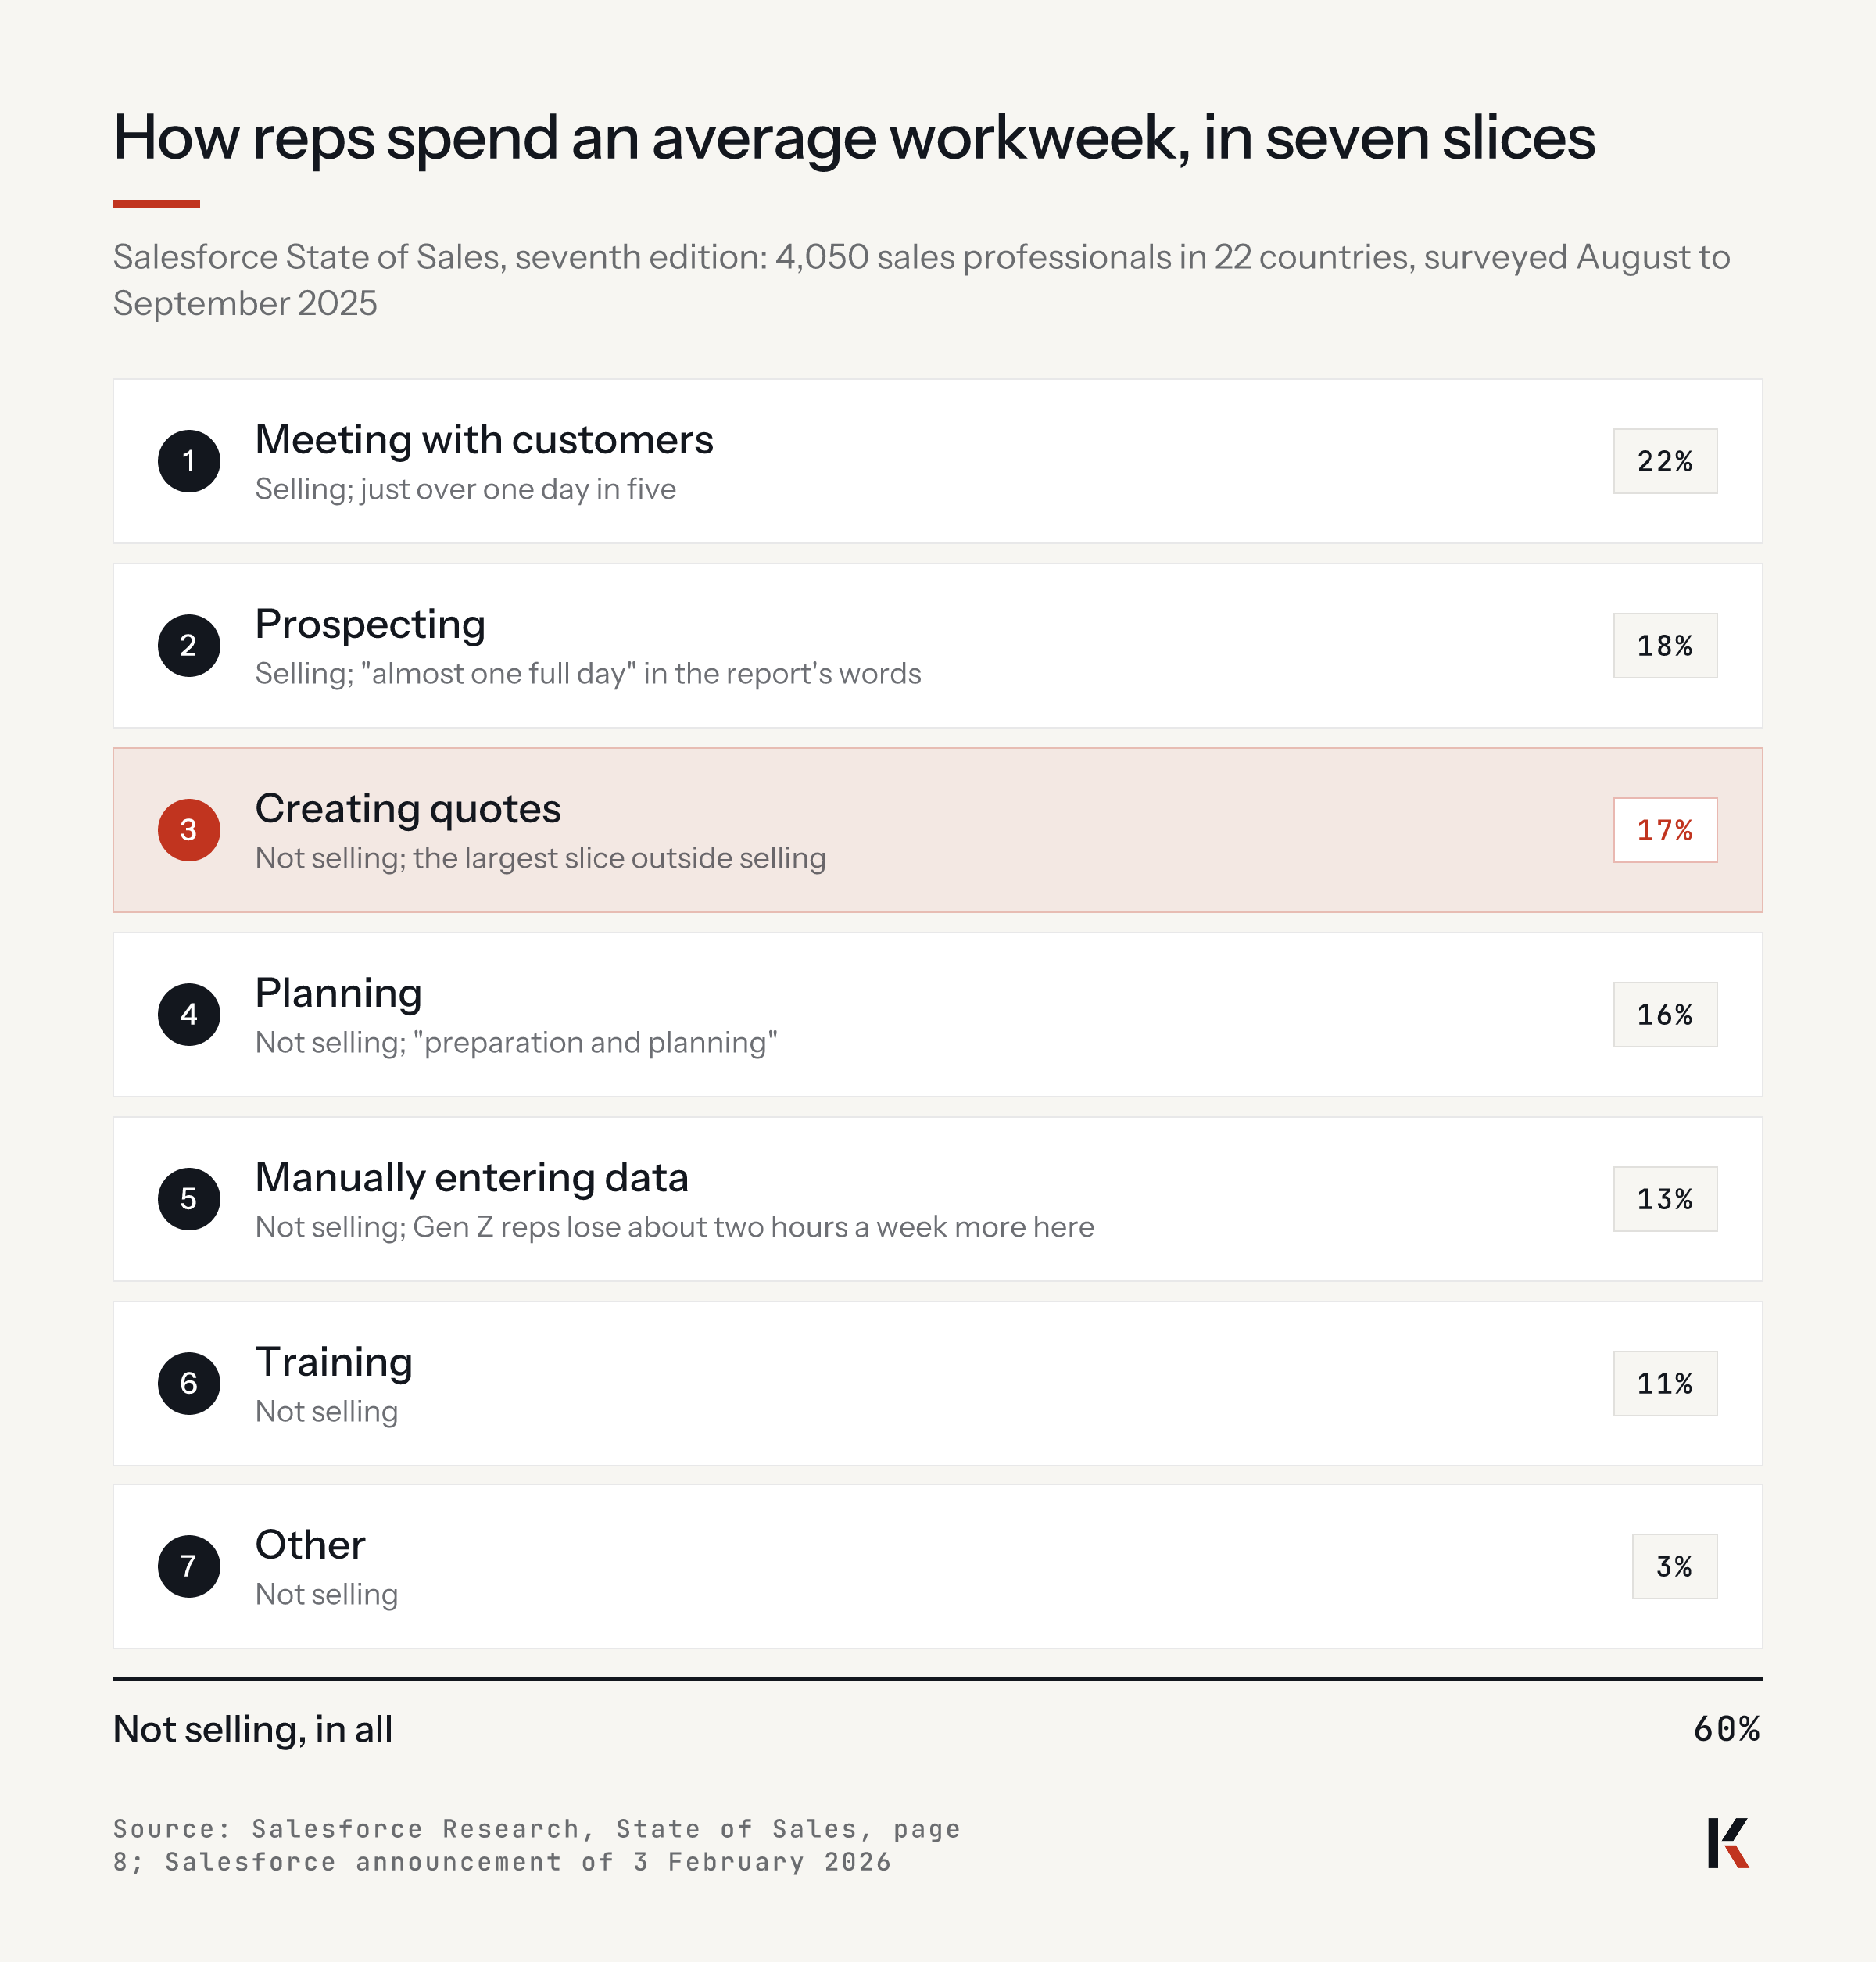
One chart shows how reps spend an average workweek.
22% of it is with customers and 18% is prospecting. The other 60% is quotes, planning, typing data by hand, training and other work.
Six weeks later, on 16 March, the same company announced Agentforce Sales. Its release says the agents save sellers "up to 25 hours per week".
It does not say how that figure was measured, or in whose week.
I read the 60% as a time-management problem with two movable parts. Quotes and manual data entry are 30% of the week, and you can take them off the rep's desk without touching the customer.
The subject is where the hours of the people who win your revenue go.
The short version
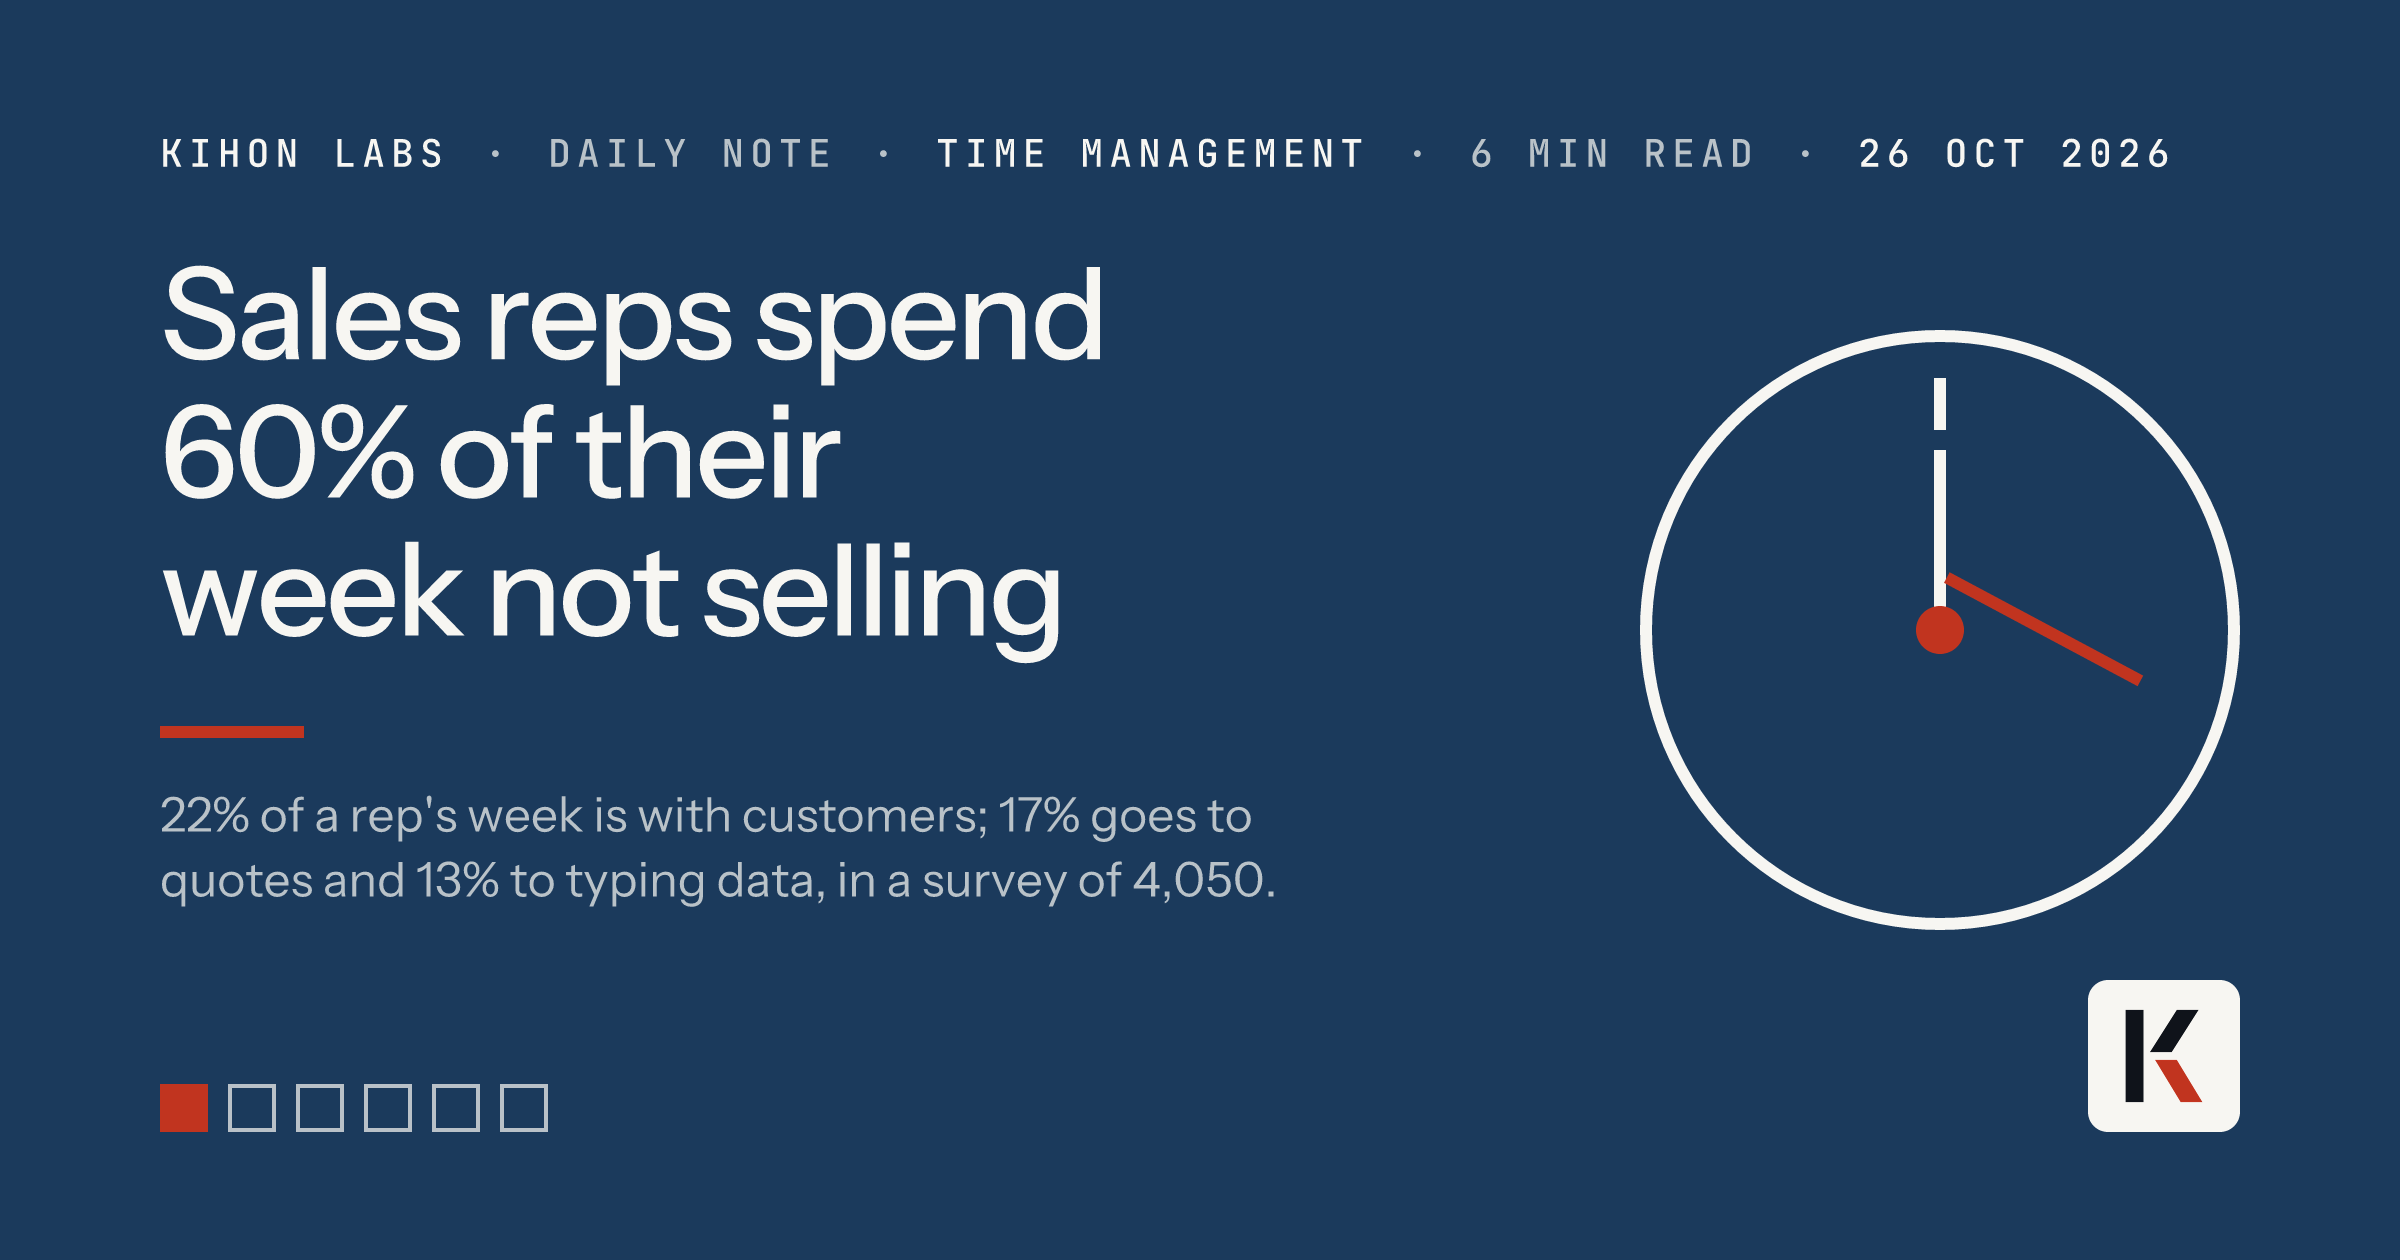
In Salesforce's survey of 4,050 sales professionals, reps spend 40% of an average week selling and 60% on other work.
Creating quotes takes 17% of the week, and entering data by hand takes 13%.
For every ten reps, those two slices add up to three full working weeks, every week.
Three days in five are not selling
The chart is on page 8 of the report, under the heading "How Reps Spend Their Time During an Average Workweek".
Seven slices: meeting with customers 22%, prospecting 18%, creating quotes 17%, planning 16%, manually entering data 13%, training 11%, other 3%.
The report groups the first two as selling, 40%, and the rest as not selling, 60%.
The text on the same page calls prospecting "nonselling work", so the report contradicts its own chart; I follow the chart.
The report calls prospecting "almost one full day of their workweek" and planning "almost a fifth of the sales pro's average week". It gives shares, not hours.
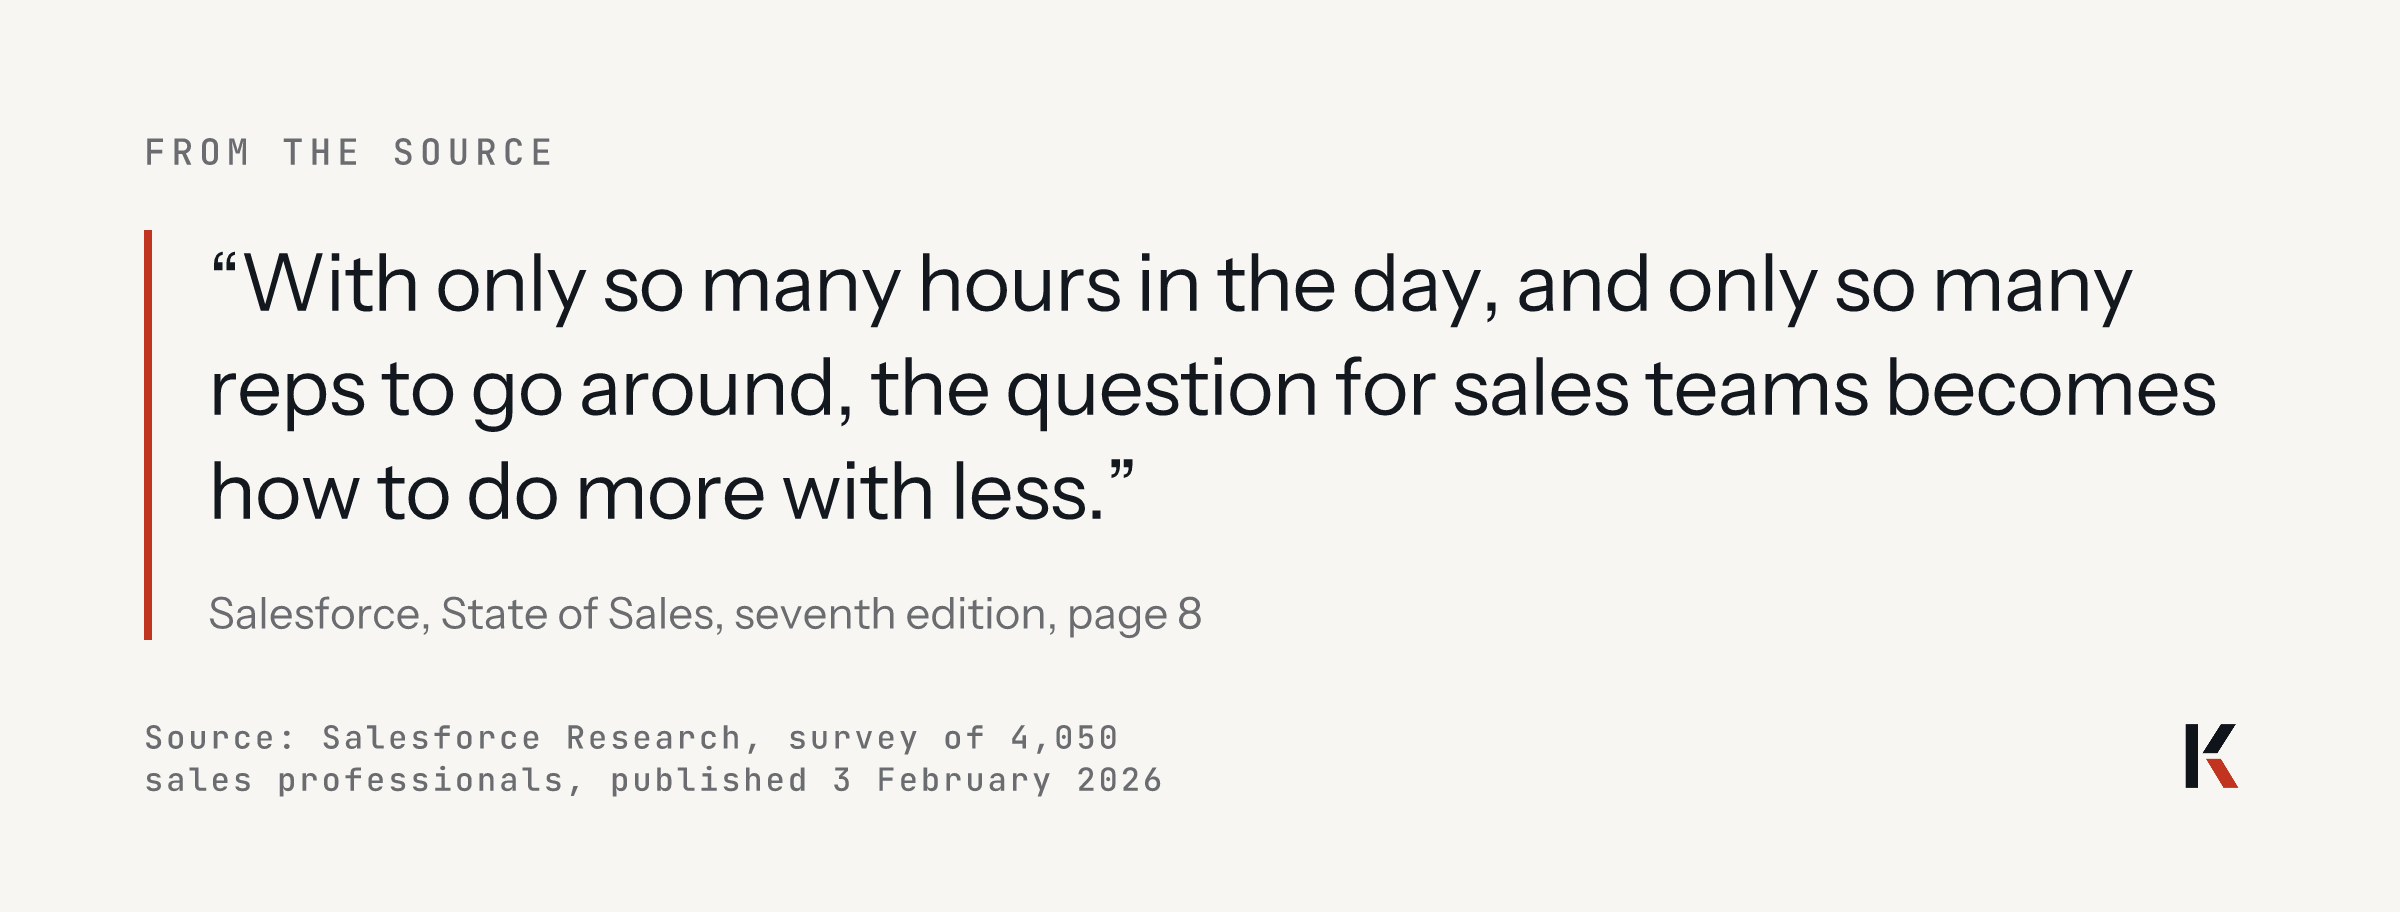
It does not say how many of the 4,050 answered this chart. The sample holds 1,032 sales reps, 1,417 sales leaders, 1,022 people in sales operations and 579 in sales support.
The same pages name the pressure on those hours. 57% of respondents say customers take longer to decide than they used to. 47% of reps say their team lacks the bandwidth to do cold outreach. 40% say their manager's lack of time is an obstacle to enablement.
The announcement of 3 February adds one split by age. The average seller spends 40% of the week selling and Gen Z reps 35%. The company puts the gap at "approximately two full hours each week" of manual data entry.
The report does not break the chart down by company size, industry or country.
One quote shows where the hours go
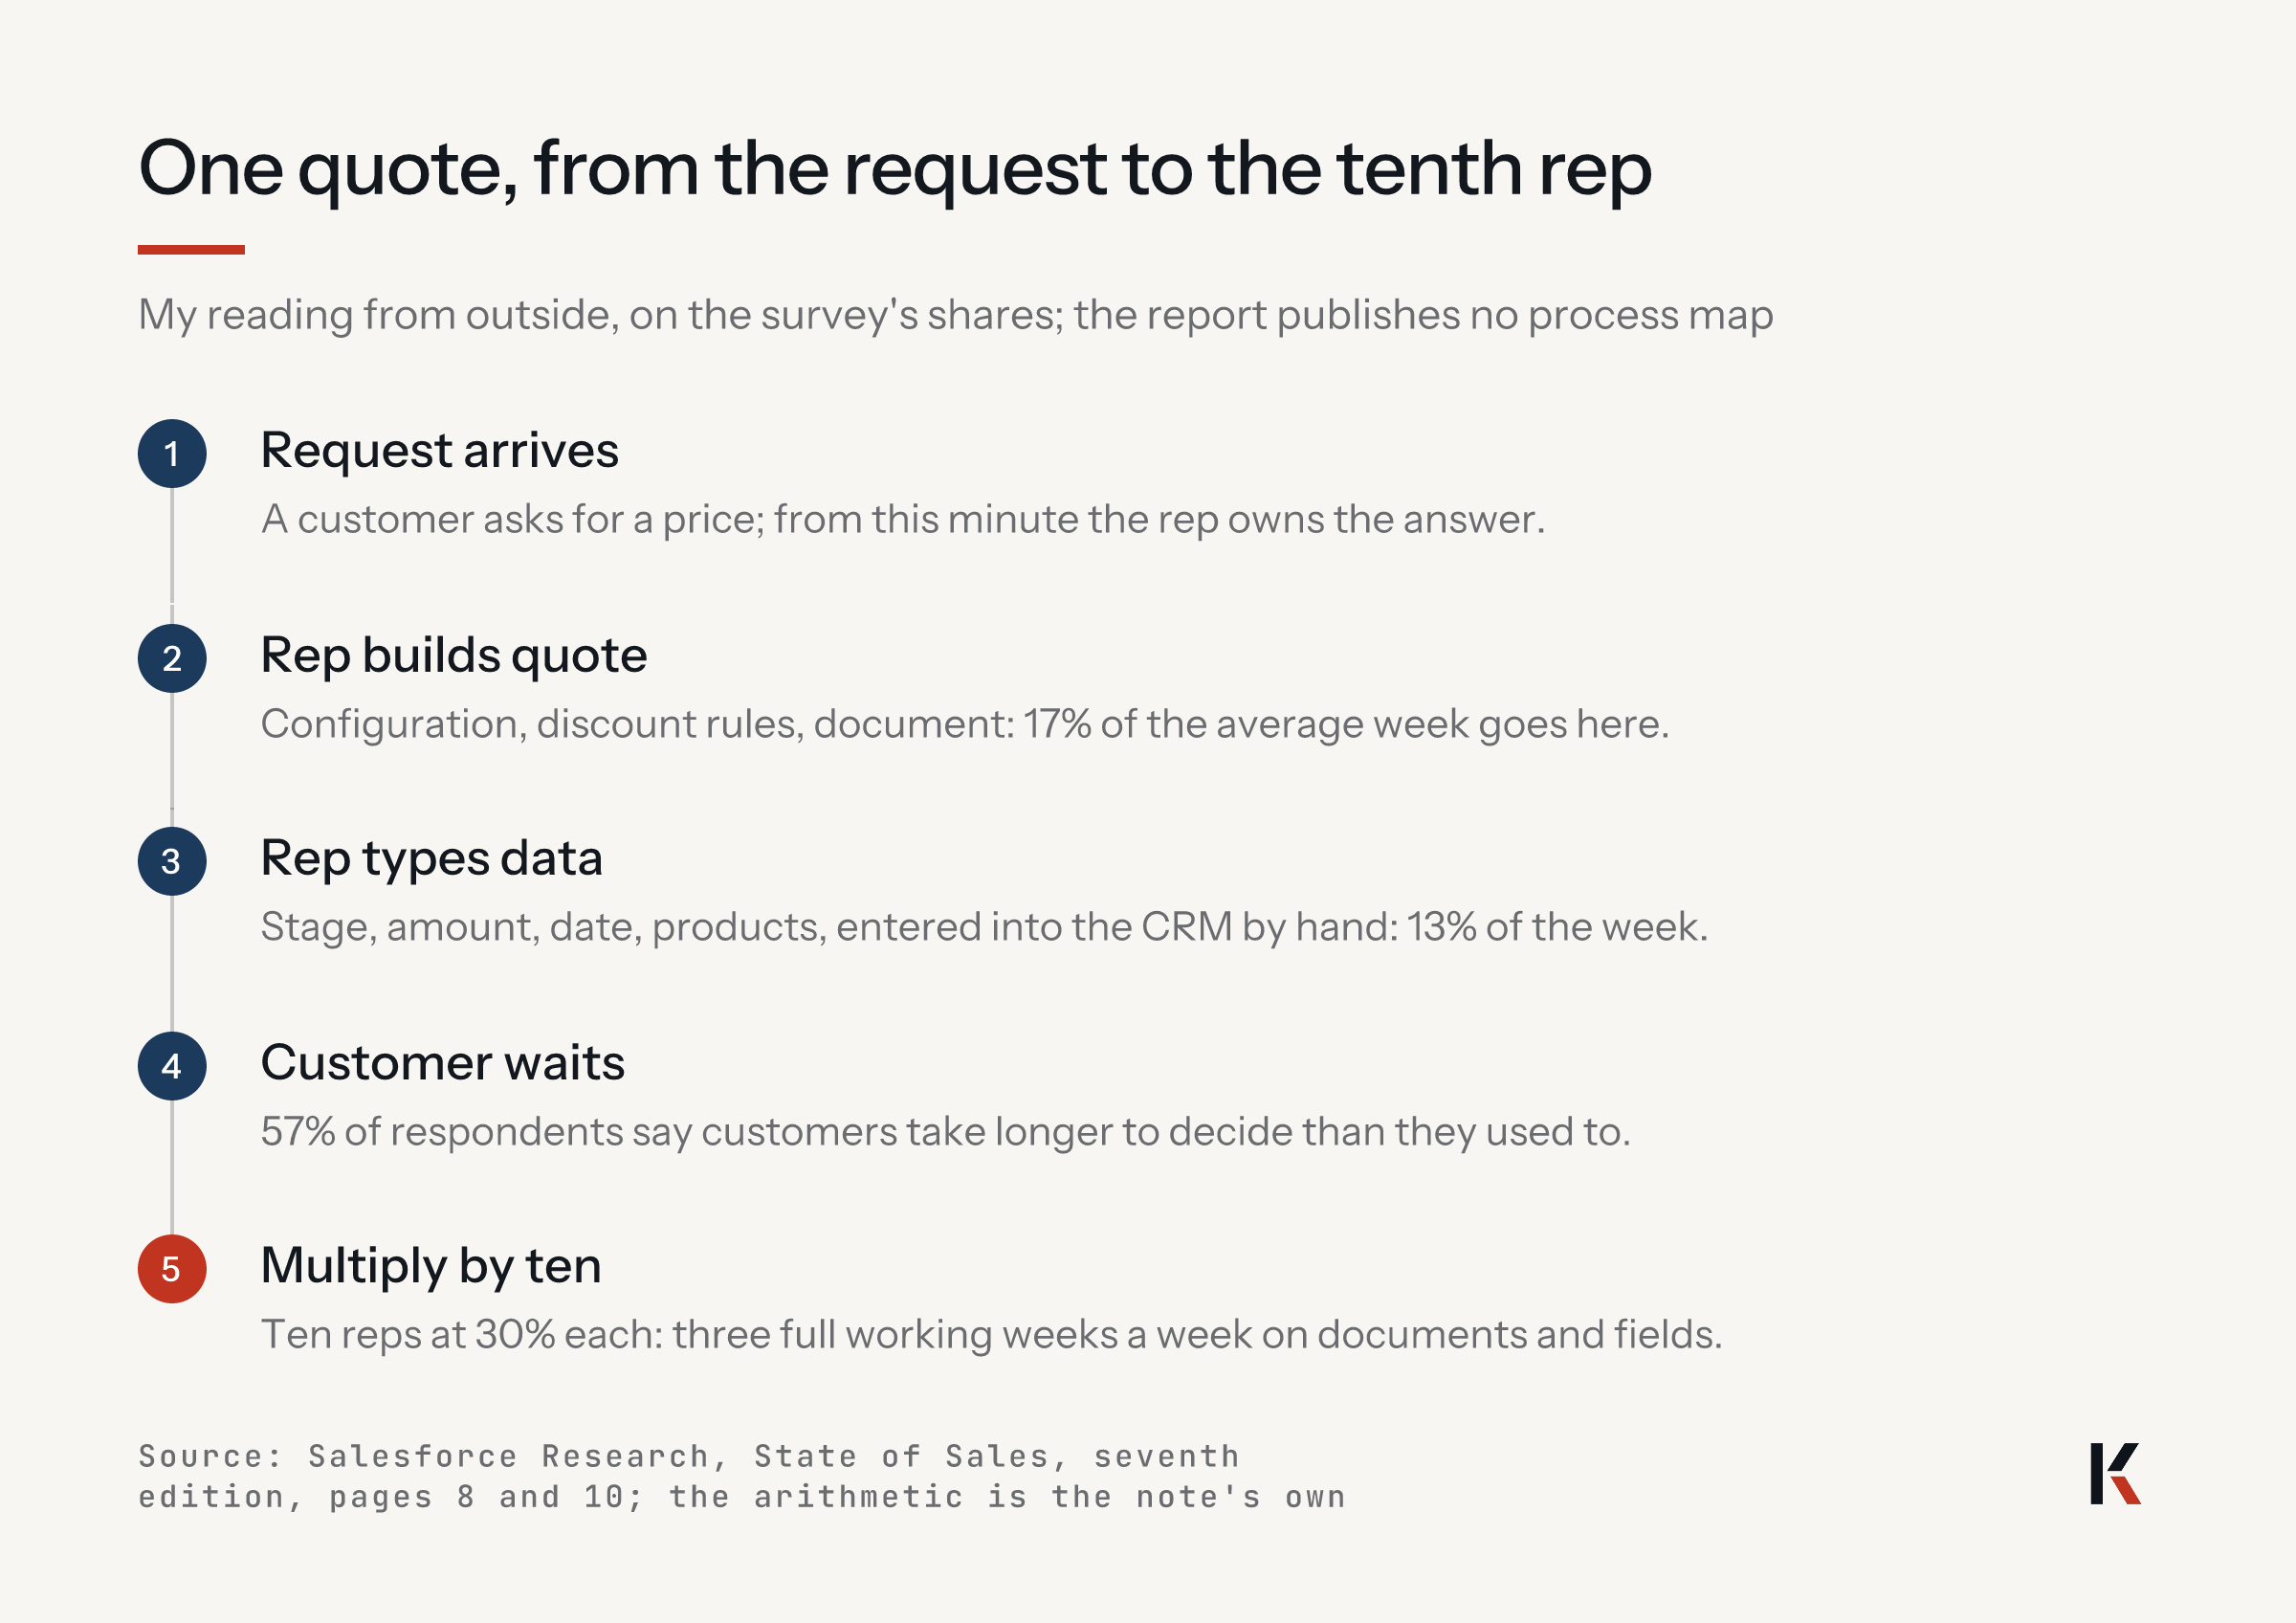
Take one quote in your own pipeline. A customer asks for a price on Tuesday. The rep opens the configuration, checks the discount rules, builds the document and sends it.
Then the rep types the deal into the CRM: stage, amount, date, products. Then the rep waits, because this customer, like 57% in the survey, takes longer to decide than before.
How that runs inside any one company is my reading from outside.
The survey gives the shares of a week, not a process map. What it does give is the weight: quote-making is 17% of the average week and data entry is 13%.
Now multiply for your team. Ten reps at 30% each is three full working weeks, every week, spent on documents and fields. In a quarter of 13 weeks that is 39 rep-weeks that never reach a customer.
In the socio-economic approach developed by Henri Savall and the ISEOR team in Lyon, this belongs to the family of time management. The rep in your team owns by default every task nobody assigned, and the hour is priced at salary, so it looks cheap.
The symptoms you would look for are in the survey too. In the 2025 survey, 63% of reps expected to miss quota that year, by my sum of the chart's bars. Lack of advancement is the first reason reps give for wanting to change jobs.
Targets missed and people who leave: the method calls these a lack of direct productivity and staff turnover.
Most of the cost is the customer meetings that were never held, which the method calls non-production. Add the salary paid for typing, which it calls excess salary.
I price the lost hour at the margin a customer hour should have produced, never at what the rep is paid.
Thirty percent of ten reps is three people
The survey carries no money, so the count stays in weeks.
Three rep-weeks a week for every ten reps you employ. 39 a quarter. 156 a year.
That is the working time of three people whose job title says they meet customers and whose calendar says they make documents.
You can put your own figure beside it: the gross margin one week of customer meetings produces in your company, times 156 for every ten reps. I give no euro amount, because the survey gives none.
Salesforce's own numbers sit on the other side of the ledger. Alfano says agents contacted 130,000 leads and created 3,200 opportunities in four months. The survey's respondents expect agents to cut prospect research time by 34% and email drafting by 36%.
Those are a vendor's own result and a survey's expectations, not a measured week in your company.
The objection I expect: "Reps have to build their own quotes; they know the deal." The deal knowledge is the rep's; the assembly and the typing are not. Respondents with agents rank creating quotes third among their agent use cases, after fulfilling orders and tracking product usage.
You will want to conclude that automation gives 30% of the week back. I would not go that far. This is the vendor's survey, answered by third-party panellists and averaged across 22 countries and 16 industries. The vendor also sells the cure.
The number that counts is your own: one month of CRM activity logs for three reps, sorted into the seven slices, before any agent is switched on.
When a sales team spends three days in five on work its own chart calls not selling, the two movable slices are where we start. Kihon fills the seven slices of this chart from a company's own calendar and CRM logs and prices each at the margin a customer hour should earn.
The ten questions of the Leak Check take two minutes and point to the slice to open first. The Diagnosis then counts it in your own figures over two months. In a scale-up, where one commercial model is split into roles that must repeat it, the quote and the CRM field are usually the first tasks nobody redesigned.
What a CRO would schedule before December
- Pull one month of CRM activity logs for three reps and sort every hour into the report's seven slices.
- Write beside quotes and data entry the name of the person or system that owns them from January.
- Price the hours moved at the margin one customer hour earns, and put that line in the 2027 plan.
Sources
- Salesforce Research, State of Sales, seventh edition (PDF, 36 pages), published 3 February 2026
- Salesforce, Salesforce Announces State of Sales Report for 2026, 3 February 2026
- Salesforce, Agentforce Sales: Agents Handle The Grind, Sellers Focus on the Win, 16 March 2026
Your turn: of the five slices of your reps' week that are not selling, which one will you move first, and to whom? Write to me at cemgorer@kihonlabs.com, or answer on LinkedIn. I read every reply.