
On 25 August 2026 Certinia, a software vendor for services businesses, published a survey of 1,000 professional services and technology leaders. Sapio Research ran the fieldwork in June 2026.
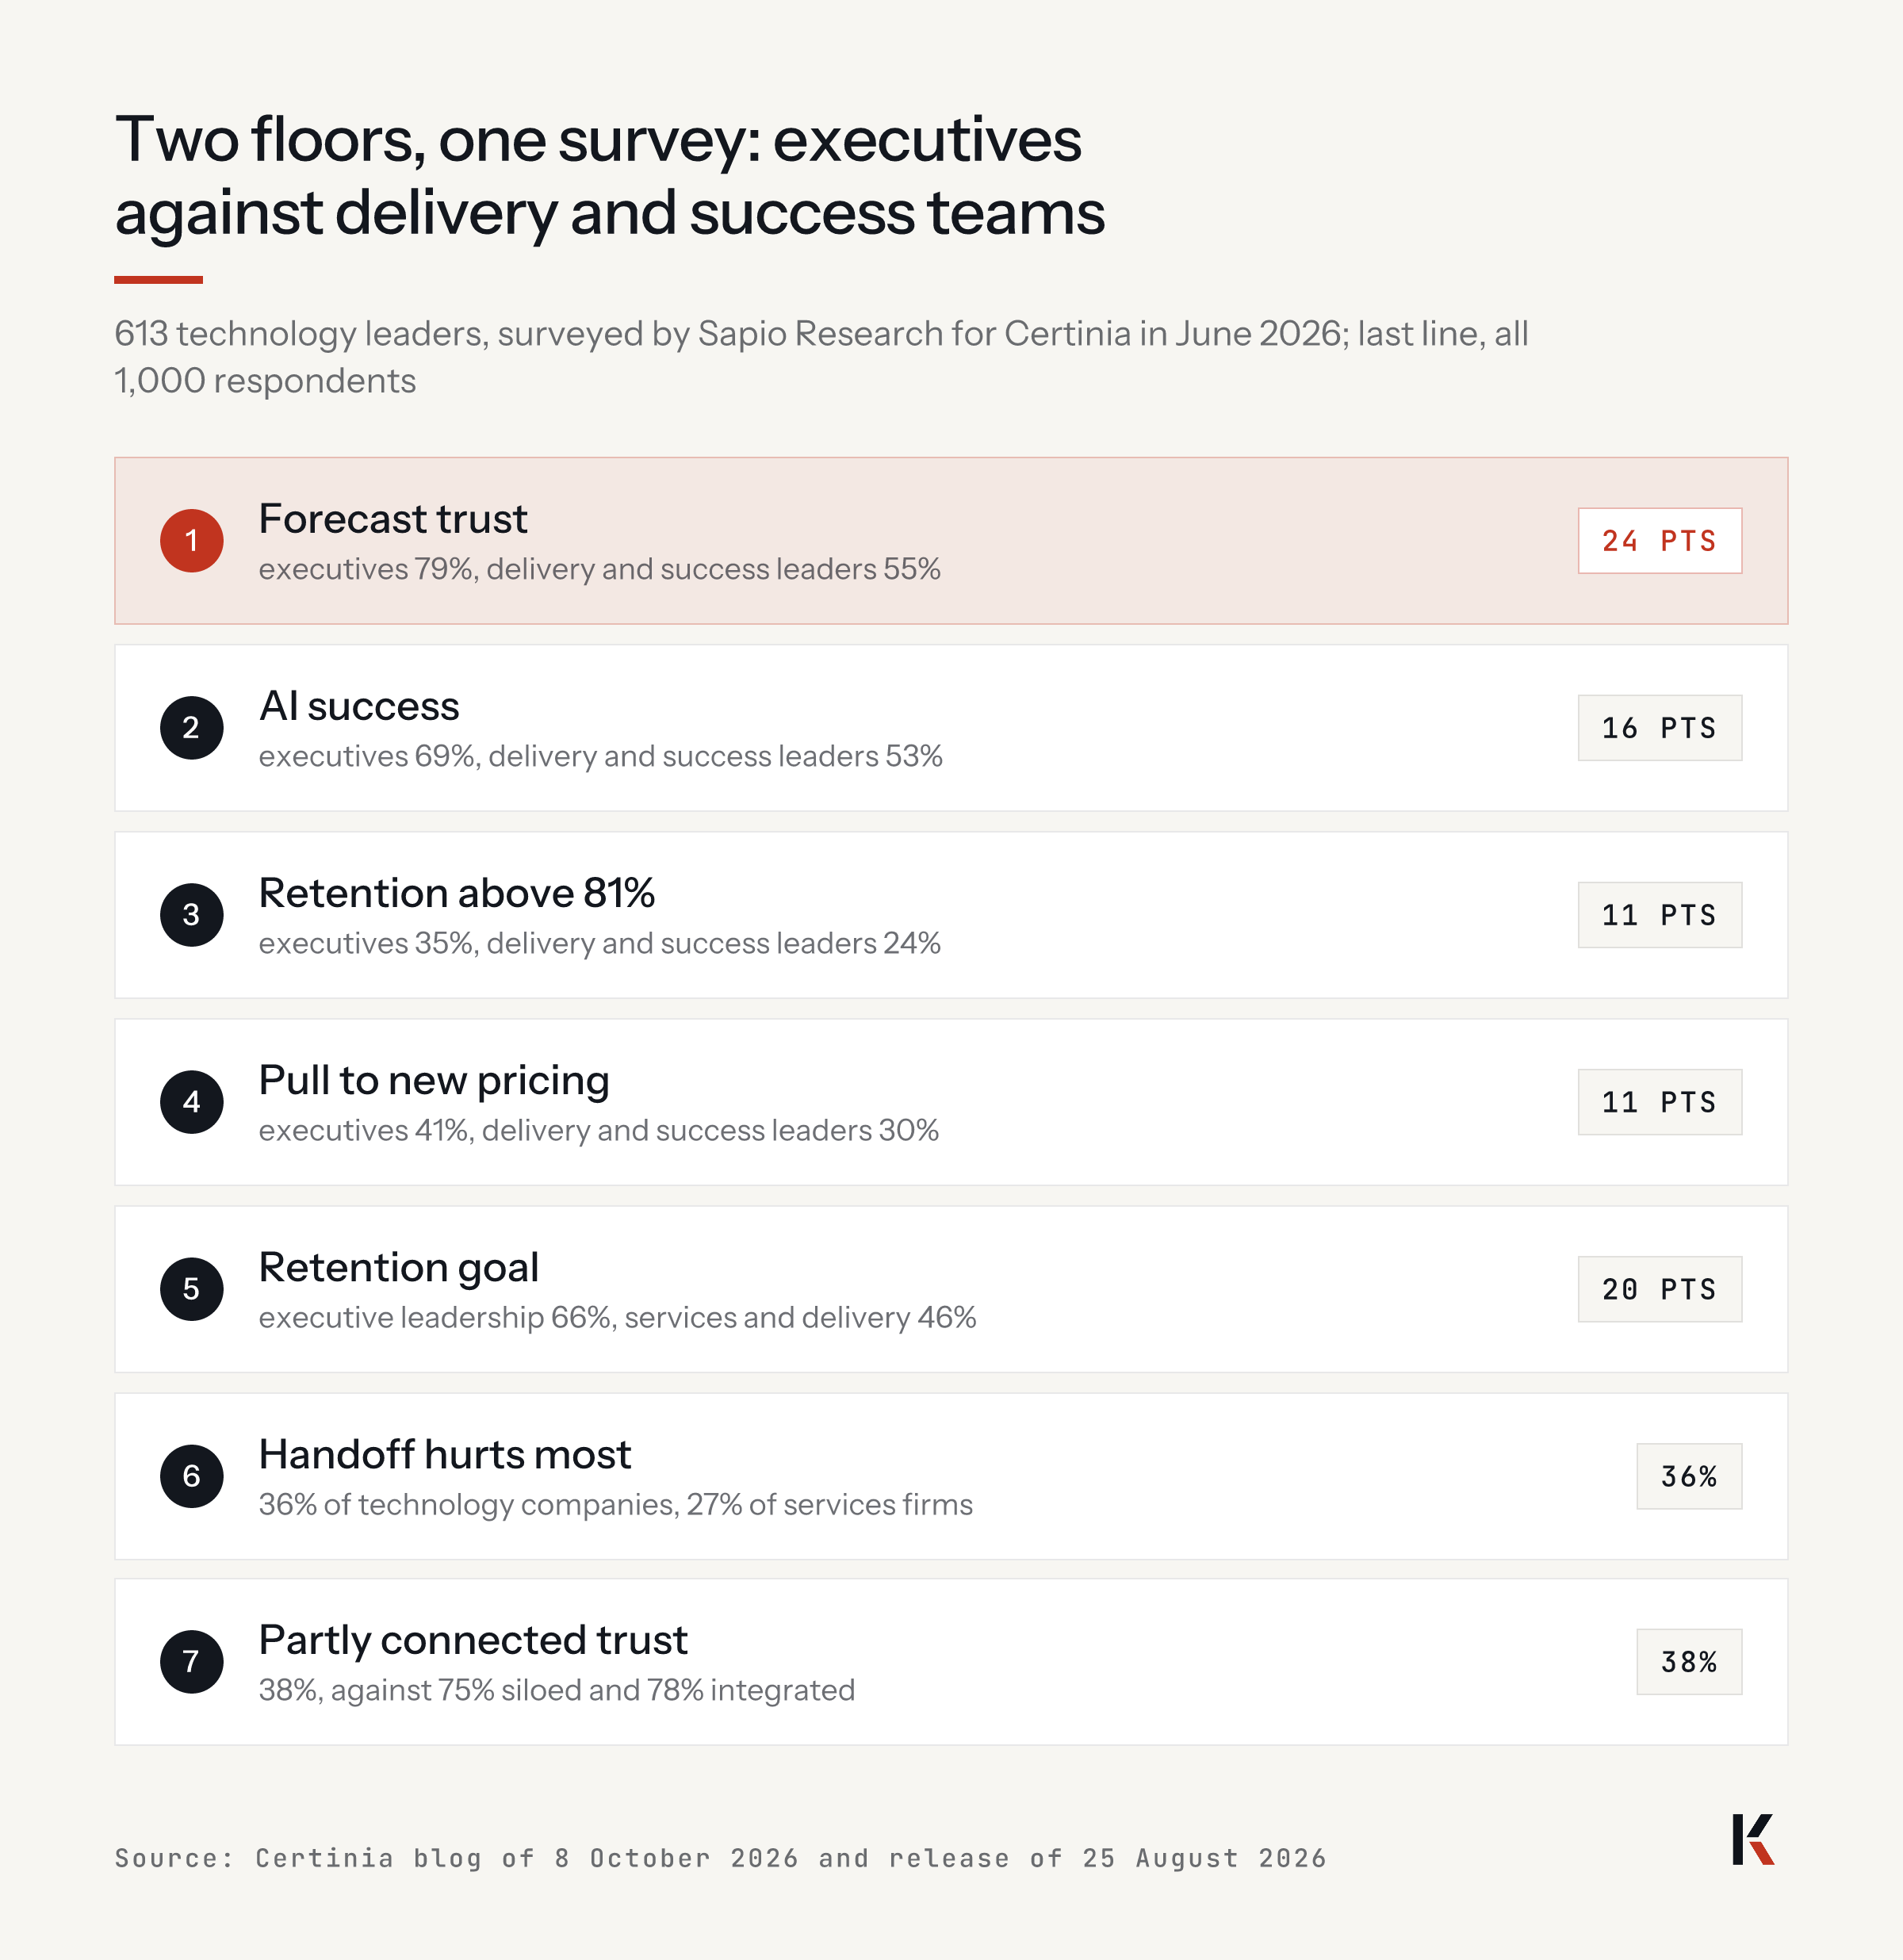
One line in the release stood out. Executives rate their forecasting confidence 24 points higher than the people who deliver the work.
On 8 October the vendor published a second cut, for the 613 respondents from software, hardware and IT service companies. 79% of executives trust their forecasting data. 55% of the professional services and customer success leaders under them say the same.
The split repeats at every stage the vendor's blog covers. The top floor and the delivery floor read the same forecast and trust it by different amounts; I read the renewal as the place where that difference is paid.
This is a communication and coordination problem, the third of the six families in the socio-economic approach, SEAM, developed by Henri Savall and the ISEOR team in Lyon.
What sales knows at signature does not always reach delivery. What delivery knows about your customer does not always travel back up. The survey is a vendor's data, and I treat it as such throughout.
The short version
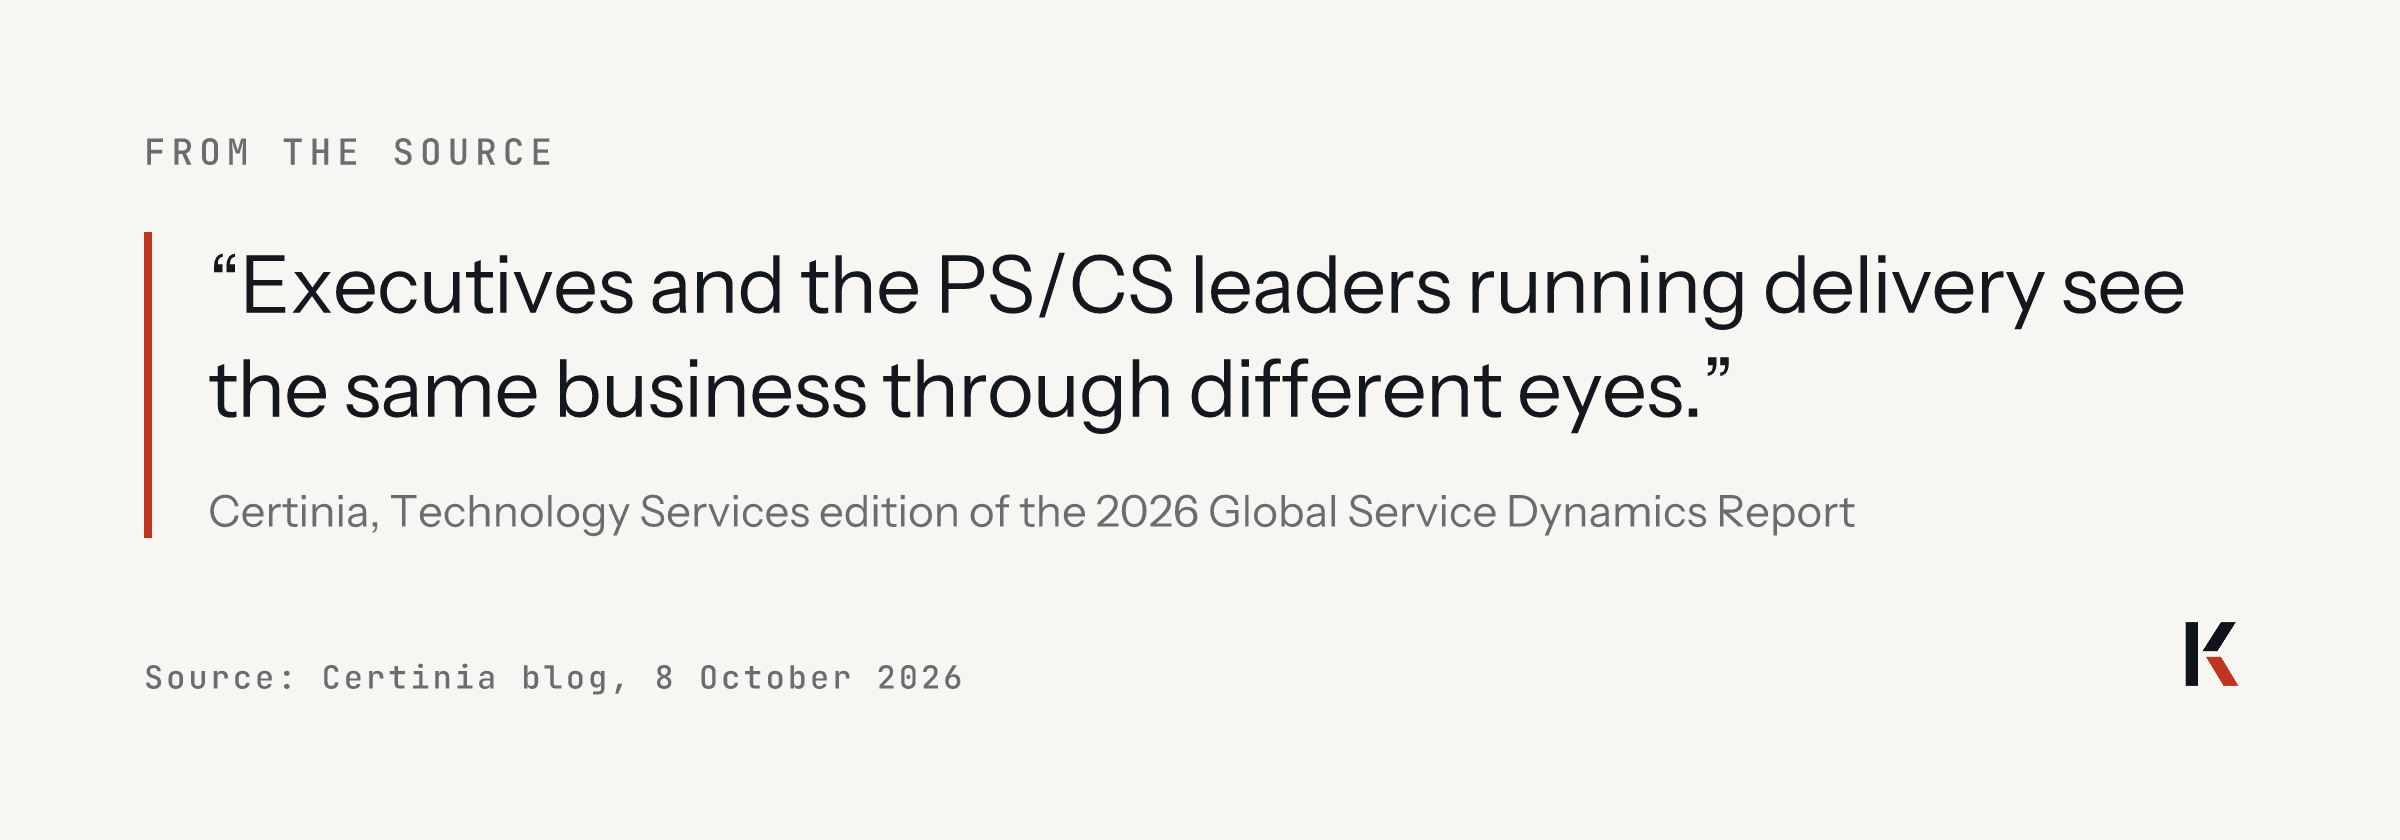
Executives trust the forecast at 79%; the delivery and customer success leaders under them trust it at 55%.
36% of technology companies say the sales-to-delivery handoff is where data gaps hurt most.
The team closest to the customer is the least likely to have a retention goal: 46% of services and delivery teams, against 66% of executive teams.
Three documents, one survey, seven gaps
The release of 25 August covers all 1,000 respondents in five markets. It gives the gap in points: forecasting confidence 24, AI success 16, growth without added headcount 10. It also says 62% of executive teams have a net revenue retention goal, against 45% of services and delivery teams.
The blog of 8 October, by Terry Melnik of Certinia, gives the figures for the 613 technology respondents. Forecast trust: 79% against 55%. AI success: 69% against 53%. Retention above 81%: 35% against 24%. The pull toward new pricing models: 41% against 30%.
A retention goal sits with 66% of executive leadership and 46% of services and delivery; finance, sales and customer success sit between, at 62%, 58% and 56%.
What the documents do not give: the questionnaire, the split of executives and practitioners inside the 613, and whether any forecast was later checked against its outcome. No company is named. The full report sits behind a download form; every Certinia number here comes from the vendor's own release and blog, and from diginomica's reports on them.
What leaves sales and never reaches delivery
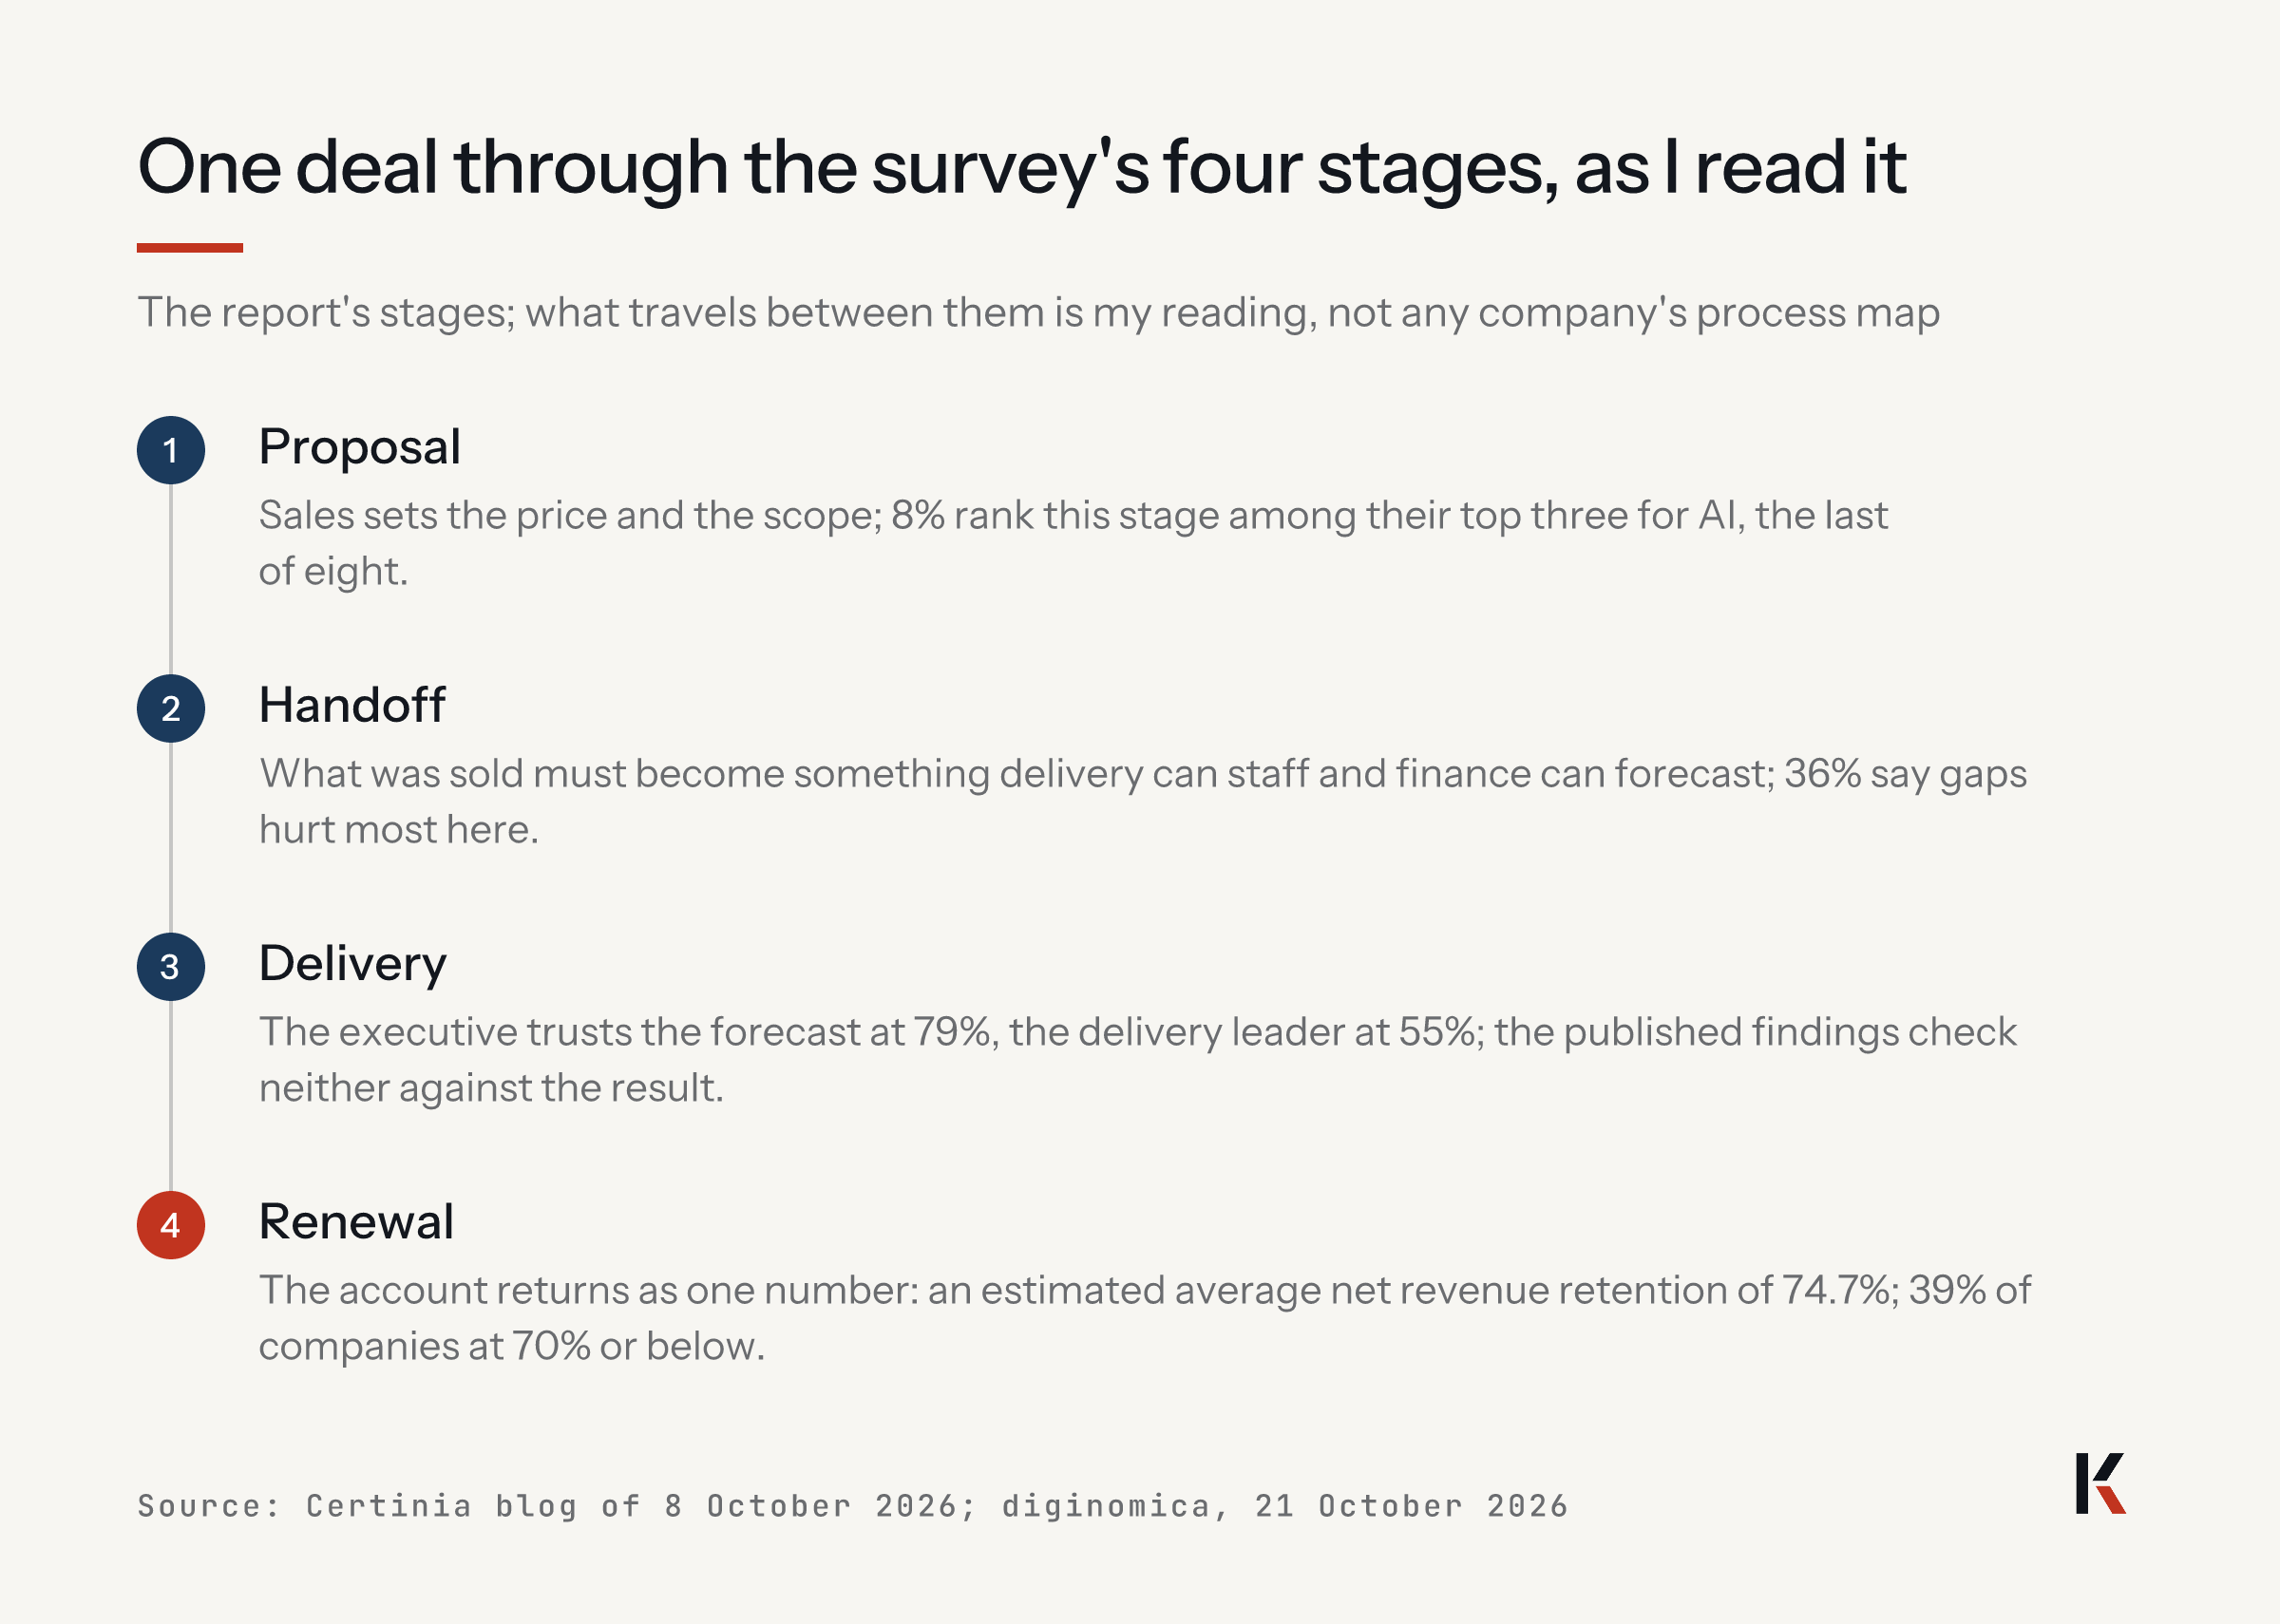
Take one deal. The vendor's blog follows the customer lifecycle through four stages: the proposal, the handoff, delivery and the renewal. How a deal travels inside any one company is my reading from outside; the survey reports no company's process.
At the proposal, sales sets a price and a scope. Only 8% of the leaders rank this stage among their top three places for AI, the last of eight.
At signature, in the blog's own words, "what Sales sold has to become something Delivery can staff and Finance can forecast". 36% of the technology companies name this handoff as the place where gaps in data and visibility hurt most, against 27% of independent services firms.
In delivery, the executive reads the forecast built on that handoff and trusts it at 79%. The person staffing the project trusts it at 55%. Nothing in the survey says the two were asked in the same room.
At renewal the account comes back as one figure: an estimated average net revenue retention of 74.7%, with 39% of the companies at 70% or below.
Multiply by a quarter's deals and you have two forecasts in one company: the one your board sees and the one your delivery floor works from. 49% of the leaders say AI and automation projects suffer most from these handoff gaps.
In plain words, this is a coordination failure: two teams share one customer and one forecast and do not share one reading of either. The symptom, as I read it, is work done twice, what the method calls non-quality: a scope re-estimated after signature, a forecast re-checked before a board meeting.
The cost shows up as revenue that never arrives: the expansion a 74.7% retention rate leaves behind, and the hours two floors spend reconciling instead of delivering, priced at the margin those hours should have produced, never at salary.
The renewal is where the two readings are settled
The survey gives no money, so I give none; the units it gives are enough for you to count with.
A net revenue retention of 74.7% means that, on average, a quarter of last year's recurring revenue from existing customers is gone this year, before any new customer is signed; that is my arithmetic on the report's figure. For 39% of the companies, at least three euros in ten leave. Only 7% sit above 100%.
Two other surveys published this year point the same way, both vendor data. Unbounce asked more than 500 go-to-market professionals at small and mid-sized businesses: 69% of executives report strong sales and marketing alignment, and 47% of non-executives agree.
Harvard Business Review Analytic Services asked 522 B2B professionals in September 2025, in a study sponsored by LeanData: 78% agree their go-to-market systems need tighter coordination, and 32% say their teams are very aligned.
An objection: confidence is a feeling, not an error rate, and a survey cannot price it. True. But a forecast that two floors trust by different amounts is reconciled by somebody, every month, in hours that could have gone to a customer. Those hours can be counted.
You may conclude that connected systems close the gap, because the vendor sells them. I would not go that far.
The same survey finds fully siloed companies almost as confident in their forecasts, at 75%, as fully integrated ones, at 78%; confidence is not accuracy, and the published findings check no forecast against its outcome. One measurement in your company decides it: last quarter's forecast as each floor rated it, beside the number that came in.
A 24-point gap between two floors is a hidden cost nobody has counted yet. Kihon puts both floors in one room with their forecast and their renewals and counts the gap in hours and reopened scopes: the Executive Workshop. Services-led technology companies sit on our professional services page. Thirty minutes on your two numbers starts here.
What a CFO would ask before the next forecast call
Do our two floors trust the same forecast?
Ask the executive team and the delivery leads to rate last quarter's forecast from one to ten, separately, this week. Among Certinia's 613 technology respondents, the two floors' confidence sat 24 points apart; yours is unknown until both are written down.
Which teams carry our retention number?
List every team that touches a renewal and mark which ones hold a retention goal in writing. In the survey, services and delivery were the least likely to hold one, at 46%, while executive leadership held one at 66%.
What data crosses from sales into delivery?
Take one deal signed last month and list what delivery received on day one: scope, pricing model, promises made, the customer's own goal. Whatever is missing on that one deal is, in my reading, missing on most of them.
Sources
- Certinia, Technology companies are chasing AI everywhere except where the deal gets made (Technology Services edition of the 2026 Global Service Dynamics Report), 8 October 2026
- Certinia, New Global Study Finds AI Success Three Times More Likely at Fully Integrated Organizations, press release, 25 August 2026
- diginomica, AI should own this stage of the services customer lifecycle, but no one has stepped up, 21 October 2026
- diginomica, Certinia 2026 Global Service Dynamics Report: spreadsheets and data sprawl hold back AI gains, 4 September 2026
- Unbounce, Sales and marketing alignment lessons from 500+ SMBs (2026 report), updated 21 July 2026
- Harvard Business Review Analytic Services, Aligning Go-to-Market Execution with Strategy, executive summary sponsored by LeanData, March 2026
Your turn: when your executive team and your delivery team last rated the same forecast, how far apart were the two numbers? Write to me at cemgorer@kihonlabs.com, or answer on LinkedIn. I read every reply.